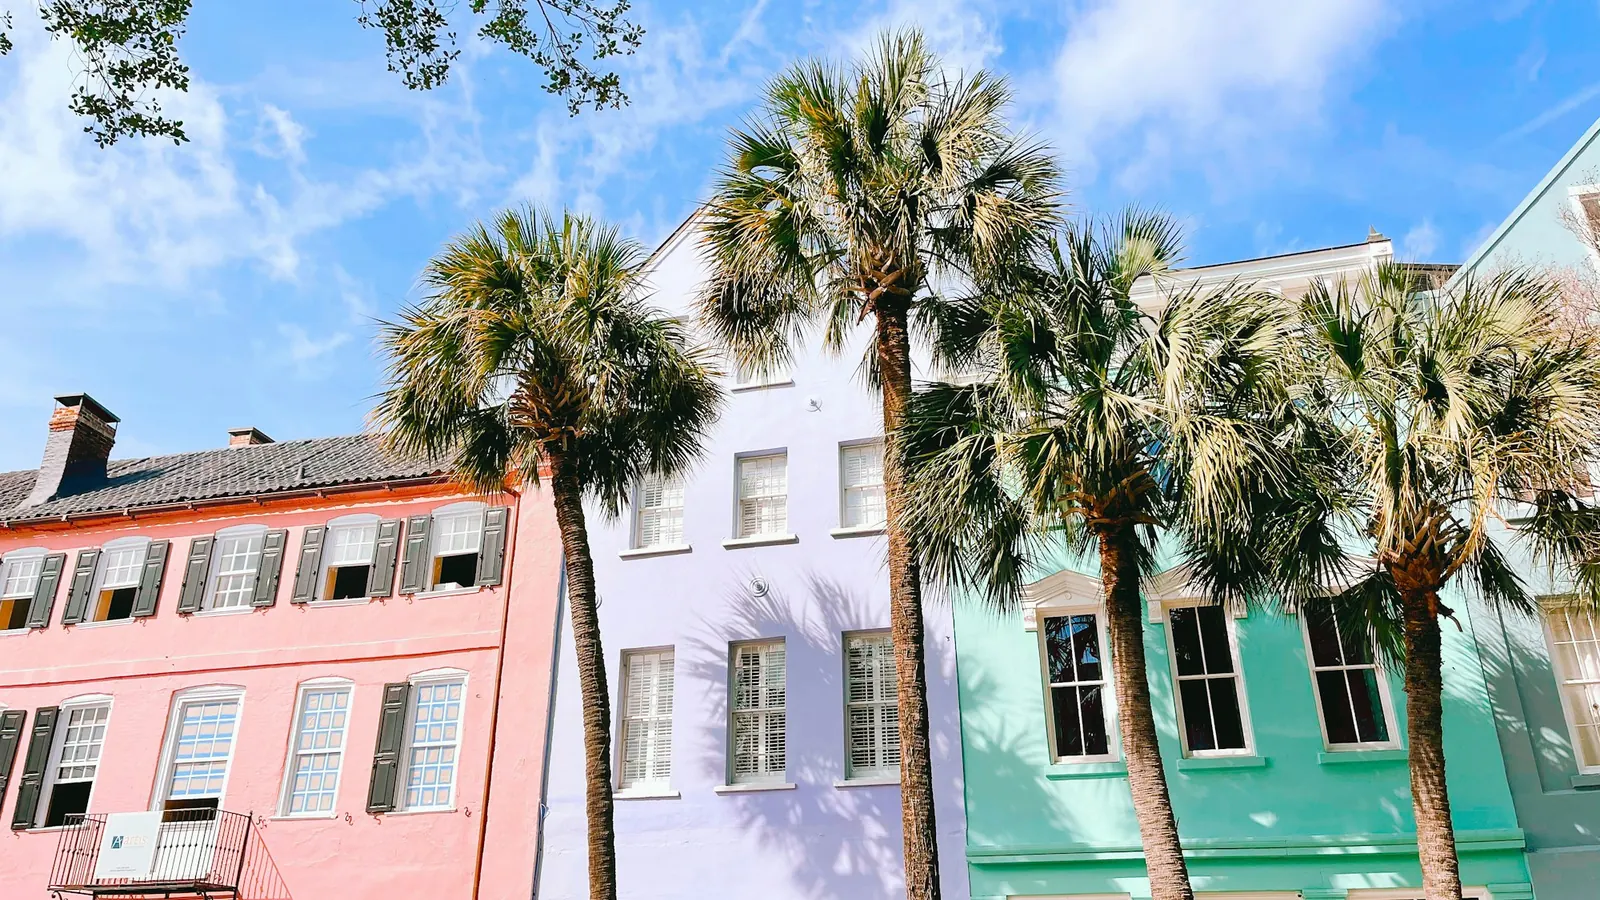
Free referral service for Charleston, Berkeley and Dorchester countiesCall or text (854) 540-1514
Call(854) 540-1514

Charleston, Mount Pleasant, James Island and Summerville

Water damage and mold help in Charleston, SC

A leak, a flooded floor or mold in the crawl space? Send one request instead of calling around. One local restoration company that serves your ZIP calls you back, looks at the damage and puts the price in writing before any work starts.

  • Water extraction and drying, mold removal, crawl spaces
  • A written scope before work, so you can compare
  • Free to you, no obligation

Get help with water or mold

About a minute. A local company calls you back.

What happened? Pick any
January 1, 2026: highest tide 5.99 ft MLLWJanuary 2, 2026: highest tide 6.41 ft MLLWJanuary 3, 2026: highest tide 6.57 ft MLLWJanuary 4, 2026: highest tide 7.25 ft MLLWJanuary 5, 2026: highest tide 6.92 ft MLLWJanuary 6, 2026: highest tide 6.46 ft MLLWJanuary 7, 2026: highest tide 5.46 ft MLLWJanuary 8, 2026: highest tide 5.41 ft MLLWJanuary 9, 2026: highest tide 5.19 ft MLLWJanuary 10, 2026: highest tide 5.1 ft MLLWJanuary 11, 2026: highest tide 4.86 ft MLLWJanuary 12, 2026: highest tide 4.74 ft MLLWJanuary 13, 2026: highest tide 5.3 ft MLLWJanuary 14, 2026: highest tide 5.44 ft MLLWJanuary 15, 2026: highest tide 4.88 ft MLLWJanuary 16, 2026: highest tide 5.31 ft MLLWJanuary 17, 2026: highest tide 5.16 ft MLLWJanuary 18, 2026: highest tide 5.49 ft MLLWJanuary 19, 2026: highest tide 5.26 ft MLLWJanuary 20, 2026: highest tide 4.98 ft MLLWJanuary 21, 2026: highest tide 5.51 ft MLLWJanuary 22, 2026: highest tide 5.35 ft MLLWJanuary 23, 2026: highest tide 5.37 ft MLLWJanuary 24, 2026: highest tide 5.71 ft MLLWJanuary 25, 2026: highest tide 5.67 ft MLLWJanuary 26, 2026: highest tide 5.5 ft MLLWJanuary 27, 2026: highest tide 4.78 ft MLLWJanuary 28, 2026: highest tide 4.97 ft MLLWJanuary 29, 2026: highest tide 5.2 ft MLLWJanuary 30, 2026: highest tide 6.25 ft MLLWJanuary 31, 2026: highest tide 6.89 ft MLLWFebruary 1, 2026: highest tide 5.88 ft MLLWFebruary 2, 2026: highest tide 6.36 ft MLLWFebruary 3, 2026: highest tide 6 ft MLLWFebruary 4, 2026: highest tide 5.73 ft MLLWFebruary 5, 2026: highest tide 5.85 ft MLLWFebruary 6, 2026: highest tide 5.78 ft MLLWFebruary 7, 2026: highest tide 4.83 ft MLLWFebruary 8, 2026: highest tide 5.42 ft MLLWFebruary 9, 2026: highest tide 5.38 ft MLLWFebruary 10, 2026: highest tide 5.38 ft MLLWFebruary 11, 2026: highest tide 4.77 ft MLLWFebruary 12, 2026: highest tide 5.24 ft MLLWFebruary 13, 2026: highest tide 5.56 ft MLLWFebruary 14, 2026: highest tide 5.74 ft MLLWFebruary 15, 2026: highest tide 5.89 ft MLLWFebruary 16, 2026: highest tide 5.91 ft MLLWFebruary 17, 2026: highest tide 6.45 ft MLLWFebruary 18, 2026: highest tide 6.22 ft MLLWFebruary 19, 2026: highest tide 5.83 ft MLLWFebruary 20, 2026: highest tide 5.63 ft MLLWFebruary 21, 2026: highest tide 6.36 ft MLLWFebruary 22, 2026: highest tide 5.48 ft MLLWFebruary 23, 2026: highest tide 4.45 ft MLLWFebruary 24, 2026: highest tide 5.46 ft MLLWFebruary 25, 2026: highest tide 5.76 ft MLLWFebruary 26, 2026: highest tide 5.53 ft MLLWFebruary 27, 2026: highest tide 5.71 ft MLLWFebruary 28, 2026: highest tide 6.47 ft MLLWMarch 1, 2026: highest tide 6.32 ft MLLWMarch 2, 2026: highest tide 6.25 ft MLLWMarch 3, 2026: highest tide 6.56 ft MLLWMarch 4, 2026: highest tide 5.86 ft MLLWMarch 5, 2026: highest tide 5.65 ft MLLWMarch 6, 2026: highest tide 5.36 ft MLLWMarch 7, 2026: highest tide 5.39 ft MLLWMarch 8, 2026: highest tide 4.62 ft MLLWMarch 9, 2026: highest tide 5.06 ft MLLWMarch 10, 2026: highest tide 4.97 ft MLLWMarch 11, 2026: highest tide 4.7 ft MLLWMarch 12, 2026: highest tide 4.42 ft MLLWMarch 13, 2026: highest tide 5.23 ft MLLWMarch 14, 2026: highest tide 5.53 ft MLLWMarch 15, 2026: highest tide 5.45 ft MLLWMarch 16, 2026: highest tide 5.87 ft MLLWMarch 17, 2026: highest tide 5.11 ft MLLWMarch 18, 2026: highest tide 6.14 ft MLLWMarch 19, 2026: highest tide 6.37 ft MLLWMarch 20, 2026: highest tide 6.47 ft MLLWMarch 21, 2026: highest tide 6.34 ft MLLWMarch 22, 2026: highest tide 6.1 ft MLLWMarch 23, 2026: highest tide 4.65 ft MLLWMarch 24, 2026: highest tide 5.85 ft MLLWMarch 25, 2026: highest tide 6.54 ft MLLWMarch 26, 2026: highest tide 6.13 ft MLLWMarch 27, 2026: highest tide 5.66 ft MLLWMarch 28, 2026: highest tide 5.66 ft MLLWMarch 29, 2026: highest tide 6.42 ft MLLWMarch 30, 2026: highest tide 6.02 ft MLLWMarch 31, 2026: highest tide 5.6 ft MLLWApril 1, 2026: highest tide 5.79 ft MLLWApril 2, 2026: highest tide 5.7 ft MLLWApril 3, 2026: highest tide 5.65 ft MLLWApril 4, 2026: highest tide 5.89 ft MLLWApril 5, 2026: highest tide 5.36 ft MLLWApril 6, 2026: highest tide 4.81 ft MLLWApril 7, 2026: highest tide 5.91 ft MLLWApril 8, 2026: highest tide 6.19 ft MLLWApril 9, 2026: highest tide 6.23 ft MLLWApril 10, 2026: highest tide 5.99 ft MLLWApril 11, 2026: highest tide 5.34 ft MLLWApril 12, 2026: highest tide 5.1 ft MLLWApril 13, 2026: highest tide 5.4 ft MLLWApril 14, 2026: highest tide 5.61 ft MLLWApril 15, 2026: highest tide 5.93 ft MLLWApril 16, 2026: highest tide 6.31 ft MLLWApril 17, 2026: highest tide 6.9 ft MLLWApril 18, 2026: highest tide 7.36 ft MLLWApril 19, 2026: highest tide 7.23 ft MLLWApril 20, 2026: highest tide 7.3 ft MLLWApril 21, 2026: highest tide 5.6 ft MLLWApril 22, 2026: highest tide 7.06 ft MLLWApril 23, 2026: highest tide 6.27 ft MLLWApril 24, 2026: highest tide 6.02 ft MLLWApril 25, 2026: highest tide 5.95 ft MLLWApril 26, 2026: highest tide 6.34 ft MLLWApril 27, 2026: highest tide 6.89 ft MLLWApril 28, 2026: highest tide 6.88 ft MLLWApril 29, 2026: highest tide 6.41 ft MLLWApril 30, 2026: highest tide 7.07 ft MLLWMay 1, 2026: highest tide 7.2 ft MLLWMay 2, 2026: highest tide 6.76 ft MLLWMay 3, 2026: highest tide 6.46 ft MLLWMay 4, 2026: highest tide 6.14 ft MLLWMay 5, 2026: highest tide 5.93 ft MLLWMay 6, 2026: highest tide 4.61 ft MLLWMay 7, 2026: highest tide 5.47 ft MLLWMay 8, 2026: highest tide 5.08 ft MLLWMay 9, 2026: highest tide 5.71 ft MLLWMay 10, 2026: highest tide 5.28 ft MLLWMay 11, 2026: highest tide 5.19 ft MLLWMay 12, 2026: highest tide 6.27 ft MLLWMay 13, 2026: highest tide 6.59 ft MLLWMay 14, 2026: highest tide 6.88 ft MLLWMay 15, 2026: highest tide 7.29 ft MLLWMay 16, 2026: highest tide 7.34 ft MLLWMay 17, 2026: highest tide 7.3 ft MLLWMay 18, 2026: highest tide 7.25 ft MLLWMay 19, 2026: highest tide 7.04 ft MLLWMay 20, 2026: highest tide 5.58 ft MLLWMay 21, 2026: highest tide 6.73 ft MLLWMay 22, 2026: highest tide 6.27 ft MLLWMay 23, 2026: highest tide 6.01 ft MLLWMay 24, 2026: highest tide 5.93 ft MLLWMay 25, 2026: highest tide 5.85 ft MLLWMay 26, 2026: highest tide 5.84 ft MLLWMay 27, 2026: highest tide 5.79 ft MLLWMay 28, 2026: highest tide 5.81 ft MLLWMay 29, 2026: highest tide 6.73 ft MLLWMay 30, 2026: highest tide 6.38 ft MLLWMay 31, 2026: highest tide 6.94 ft MLLWJune 1, 2026: highest tide 6.39 ft MLLWJune 2, 2026: highest tide 6.86 ft MLLWJune 3, 2026: highest tide 6.81 ft MLLWJune 4, 2026: highest tide 6.27 ft MLLWJune 5, 2026: highest tide 5.09 ft MLLWJune 6, 2026: highest tide 5.93 ft MLLWJune 7, 2026: highest tide 5.56 ft MLLWJune 8, 2026: highest tide 5.3 ft MLLWJune 9, 2026: highest tide 6.09 ft MLLWJune 10, 2026: highest tide 6.18 ft MLLWJune 11, 2026: highest tide 6.2 ft MLLWJune 12, 2026: highest tide 6.51 ft MLLWJune 13, 2026: highest tide 6.92 ft MLLWJune 14, 2026: highest tide 6.76 ft MLLWJune 15, 2026: highest tide 7.15 ft MLLWJune 16, 2026: highest tide 7.02 ft MLLWJune 17, 2026: highest tide 6.67 ft MLLWJune 18, 2026: highest tide 6.25 ft MLLWJune 19, 2026: highest tide 4.65 ft MLLWJune 20, 2026: highest tide 5.73 ft MLLWJune 21, 2026: highest tide 5.95 ft MLLWJune 22, 2026: highest tide 5.75 ft MLLWJune 23, 2026: highest tide 5.22 ft MLLWJune 24, 2026: highest tide 6.12 ft MLLWJune 25, 2026: highest tide 6.08 ft MLLWJune 26, 2026: highest tide 5.86 ft MLLWJune 27, 2026: highest tide 5.67 ft MLLWJune 28, 2026: highest tide 5.82 ft MLLWJune 29, 2026: highest tide 5.98 ft MLLWJune 30, 2026: highest tide 6.72 ft MLLWJuly 1, 2026: highest tide 6.42 ft MLLWJuly 2, 2026: highest tide 6.31 ft MLLWJuly 3, 2026: highest tide 6.17 ft MLLWJuly 4, 2026: highest tide 5.47 ft MLLWJuly 5, 2026: highest tide 5.83 ft MLLWJuly 6, 2026: highest tide 5.6 ft MLLWJuly 7, 2026: highest tide 5.3 ft MLLWJuly 8, 2026: highest tide 5.7 ft MLLWJuly 9, 2026: highest tide 6.11 ft MLLWJuly 10, 2026: highest tide 6.2 ft MLLWJuly 11, 2026: highest tide 6.32 ft MLLWJuly 12, 2026: highest tide 6.92 ft MLLWJuly 13, 2026: highest tide 7.53 ft MLLWJuly 14, 2026: highest tide 7.68 ft MLLWJuly 15, 2026: highest tide 7.5 ft MLLWJuly 16, 2026: highest tide 6.89 ft MLLWJuly 17, 2026: highest tide 6.4 ft MLLWJuly 18, 2026: highest tide 5.85 ft MLLWJuly 19, 2026: highest tide 5.82 ft MLLWJuly 20, 2026: highest tide 5.41 ft MLLWJuly 21, 2026: highest tide 5.41 ft MLLWJuly 22, 2026: highest tide 5.3 ft MLLWJuly 23, 2026: highest tide 5.31 ft MLLWJuly 24, 2026: highest tide 5.75 ft MLLWJuly 25, 2026: highest tide 5.82 ft MLLWJuly 26, 2026: highest tide 6.63 ft MLLWJuly 27, 2026: highest tide 6.83 ft MLLWJuly 28, 2026: highest tide 6.77 ft MLLWJuly 29, 2026: highest tide 6.64 ft MLLWJuly 30, 2026: highest tide 6.72 ft MLLWJuly 31, 2026: highest tide 6.44 ft MLLWAugust 1, 2026: highest tide 6.05 ft MLLWAugust 2, 2026: highest tide 5.37 ft MLLWAugust 3, 2026: highest tide 5.35 ft MLLWAugust 4, 2026: highest tide 5.42 ft MLLWAugust 5, 2026: highest tide 5.47 ft MLLWAugust 6, 2026: highest tide 5.75 ft MLLWAugust 7, 2026: highest tide 5.96 ft MLLWAugust 8, 2026: highest tide 6.21 ft MLLWAugust 9, 2026: highest tide 6.34 ft MLLWAugust 10, 2026: highest tide 6.51 ft MLLWAugust 11, 2026: highest tide 6.8 ft MLLWAugust 12, 2026: highest tide 7.28 ft MLLWAugust 13, 2026: highest tide 6.94 ft MLLWAugust 14, 2026: highest tide 6.43 ft MLLWAugust 15, 2026: highest tide 6.11 ft MLLWAugust 16, 2026: highest tide 6.28 ft MLLWAugust 17, 2026: highest tide 5.9 ft MLLWAugust 18, 2026: highest tide 5.62 ft MLLWAugust 19, 2026: highest tide 5.71 ft MLLWAugust 20, 2026: highest tide 5.72 ft MLLWAugust 21, 2026: highest tide 5.31 ft MLLWAugust 22, 2026: highest tide 5.67 ft MLLWAugust 23, 2026: highest tide 5.55 ft MLLWAugust 24, 2026: highest tide 5.59 ft MLLWAugust 25, 2026: highest tide 5.96 ft MLLWAugust 26, 2026: highest tide 6 ft MLLWAugust 27, 2026: highest tide 6.13 ft MLLWAugust 28, 2026: highest tide 5.86 ft MLLWAugust 29, 2026: highest tide 5.94 ft MLLWAugust 30, 2026: highest tide 6.01 ft MLLWAugust 31, 2026: highest tide 6.41 ft MLLWSeptember 1, 2026: highest tide 6.32 ft MLLWSeptember 2, 2026: highest tide 6.22 ft MLLWSeptember 3, 2026: highest tide 6.25 ft MLLWSeptember 4, 2026: highest tide 6.27 ft MLLWSeptember 5, 2026: highest tide 6.13 ft MLLWSeptember 6, 2026: highest tide 6.86 ft MLLWSeptember 7, 2026: highest tide 7.49 ft MLLWSeptember 8, 2026: highest tide 7.63 ft MLLWSeptember 9, 2026: highest tide 7.29 ft MLLWSeptember 10, 2026: highest tide 7.16 ft MLLWSeptember 11, 2026: highest tide 6.76 ft MLLWSeptember 12, 2026: highest tide 6.75 ft MLLWSeptember 13, 2026: highest tide 6.37 ft MLLWSeptember 14, 2026: highest tide 6.34 ft MLLWSeptember 15, 2026: highest tide 6.95 ft MLLWSeptember 16, 2026: highest tide 6.53 ft MLLWSeptember 17, 2026: highest tide 6.27 ft MLLWSeptember 18, 2026: highest tide 5.79 ft MLLWSeptember 19, 2026: highest tide 5.75 ft MLLWSeptember 20, 2026: highest tide 6.19 ft MLLWSeptember 21, 2026: highest tide 6.05 ft MLLWSeptember 22, 2026: highest tide 6.43 ft MLLWSeptember 23, 2026: highest tide 6.83 ft MLLWSeptember 24, 2026: highest tide 7.44 ft MLLWSeptember 25, 2026: highest tide 7.56 ft MLLWSeptember 26, 2026: highest tide 7.5 ft MLLWSeptember 27, 2026: highest tide 7.76 ft MLLWSeptember 28, 2026: highest tide 7.77 ft MLLWSeptember 29, 2026: highest tide 7.41 ft MLLWSeptember 30, 2026: highest tide 7.03 ft MLLW
Every day of 2026 so far at the Charleston Harbor gauge, colored by that day's highest tide. 29 days reached the National Weather Service minor flood stage of 7 feet through September 30, 2026.under 5.5 ft5.5 to 66 to 6.5action 6.5minor flood 7moderate 7.5major 8+NOAA CO-OPS station 8665530, verified high tides. Flood stages: NWS gauge CHTS1.

Free to youNo cost, no obligation

Written scope firstPrice in writing before work

Moisture readingsPhotos at start and finish

Local to the LowcountryCharleston, Berkeley, Dorchester

Water coming in right now?

Call or text us, then do these three things while you wait.

  1. Stop the water. Close the valve under the fixture, or the main shutoff where the line enters the house. For a water heater, close the cold inlet on top.
  2. Stay safe around power. Don't walk through water near outlets or cords. Turn off breakers for wet rooms only if you can reach the panel while standing somewhere dry.
  3. Photograph before you move things. Get wide shots and the source. Then lift rugs and furniture off wet floors.

Flooding from a storm or a king tide? Stay out of standing water outdoors. The first 48 hours, step by step.

The local numbers

51.5

days a year the harbor reached minor flood stage, 2016-2025 average. It was 26.3 over 1992-2020.

140

days a year at the airport with an average dew point of 65°F or more (2016-2024), the air that keeps crawl spaces damp.

20,687

federal flood insurance claims filed in Charleston, Berkeley and Dorchester counties, $337 million paid.

12.52 ft

the harbor crest in Hurricane Hugo, September 22, 1989. Minor flooding starts at 7 feet; the gauge passed 9.8 feet twice since 2017.

NOAA CO-OPS station 8665530 through September 30, 2026; NOAA NCEI station 72208013880; OpenFEMA NFIP redacted claims. Method and full data.

How it works

One call instead of five

  1. Tell us what got wet, or what you found. Use the form or text photos. Say how long it has been wet if you know.
  2. A local restoration company calls you back. They ask a few questions and set a time to look at it.
  3. You get a written scope and price before work starts. You decide. If insurance is involved, ask how they document the job.
Send a request

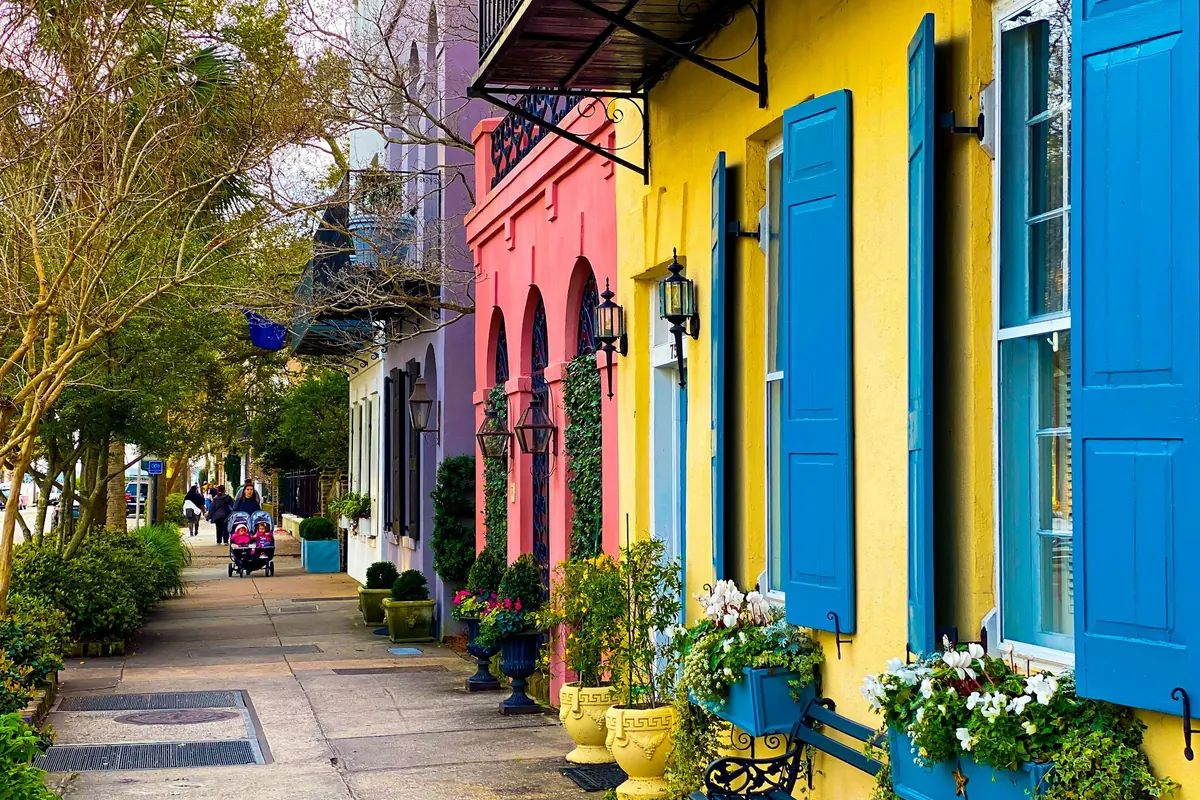
Colorful Charleston row houses with blue shutters and window boxes
Older Charleston houses often sit on piers over a crawl space, open to the humid air. Photo: Leo Heisenberg / Unsplash

What we ask of every company we refer

The four things to expect

Restoration jobs go wrong in the same few ways: a vague scope, no proof the house is dry, a form signed in a hurry. We ask for these up front. If a visit falls short, tell us at (854) 540-1514.

  • A written scope and price before work starts. What gets removed, what gets dried, and for how long.
  • Moisture readings and photos. Taken at the start and the end, so any adjuster can see the job was finished.
  • No pressure to sign on the spot. You can read anything before you sign it, including any form that mentions your insurance.
  • The cause fixed, not only the symptom. Mold comes back when the moisture source stays.

Before anyone quotes you

What this work usually costs

These are published national price ranges, not a Charleston quote. The company prices your job in writing before work starts.

Already holding a quote? Check it against the published ranges and the usual upsells.

Full cost guide

JobPublished rangeSource
Mold remediation$1,500 to $9,000, $3,500 averageFixr, Aug 2025
Mold removal, crawl space$500 to $2,000Fixr, Aug 2025
Mold inspection$450 to $800, $500 averageFixr, Jan 2025
Water damage restoration$1,200 to $5,000, $3,000 averageFixr, Jan 2025
Water extraction$3.75 to $7.50 per square footFixr, Jan 2025
Crawl space encapsulation$1,500 to $15,000, $5,500 typicalThis Old House, Mar 2026
Crawl space dehumidifier, installed$800 to $2,000This Old House, Mar 2026

National published figures from Fixr and This Old House, not local averages and not our quote. Sources and dates are listed in the cost guide.

Original analysis of NOAA data

Why Charleston houses take on water, and keep it

Two things set the Lowcountry apart. The first is the tide. The NOAA gauge in Charleston Harbor reached the National Weather Service minor flood stage of 7 feet on an average of 26.3 days a year over 1992-2020. Over 2016-2025 it was 51.5, and 2019 had 75. Tidal flooding is mostly streets and yards, but it backs up storm drains and pushes water toward low crawl spaces and slabs.

The second is the air. On about 140 days a year the airport's average dew point is 65°F or higher. In July and August it averages about 73.2°F. The EPA says to keep indoor humidity below 60 percent. In a vented crawl space under a raised house, summer air that humid can condense on cool ducts and floor framing.

Put the two together with older housing and you get the jobs restoration companies see most here: wet subfloors, musty crawl spaces, and mold behind walls after a leak nobody caught. Charleston humidity and mold.

Days per year the harbor reached minor flood stage (7 ft)

1980: 8 days19801981: 11 days1982: 2 days1983: 18 days1984: 9 days1985: 13 days1986: 16 days1987: 5 days1988: 1 days1989: 5 days1992: 15 days19921993: 21 days1994: 14 days1995: 28 days1996: 6 days1997: 19 days1998: 13 days1999: 33 days2000: 24 days2001: 16 days2002: 19 days20022003: 19 days2004: 7 days2005: 17 days2006: 17 days2007: 27 days2008: 20 days2009: 30 days2010: 18 days2011: 11 days2012: 26 days20122013: 29 days2014: 37 days2015: 44 days2016: 45 days2017: 41 days2018: 37 days2019: 75 days752020: 54 days2021: 42 days2022: 64 days20222023: 66 days2024: 48 days2025: 43 days2026: 29 days2920261992-2020 average: 26.3
Source: NOAA CO-OPS verified high tides, Charleston station 8665530, counted against the NWS minor flood stage. Years with gaps are left out. 2026 runs through September 30, 2026.

Average muggy days (dew point 65°F or higher), by month

Jan: 0.6 daysJanFeb: 0.2 daysFebMar: 0.9 daysMarApr: 2.6 daysAprMay: 14.7 daysMayJun: 25.6 days25.6JunJul: 30.3 days30.3JulAug: 30.4 days30.4AugSep: 23.1 days23.1SepOct: 9.6 daysOctNov: 2.4 daysNovDec: 0 daysDec
Source: NOAA NCEI Global Summary of the Day, Charleston International Airport, 2016-2024 average.

Older houses on low ground

About 17% of the 352,574 homes in the 27 ZIP codes we cover were built before 1980 (Census ACS 2020-2024). On the peninsula the median home was built in 1938. Older houses mean older supply lines, cast iron drains and crawl spaces that were never sealed.

The federal flood insurance program has recorded 20,687 claims in Charleston, Berkeley and Dorchester counties. The most are in 29401 (Downtown Charleston, 3,215), 29451 (Isle of Palms, 2,691), 29412 (James Island, 2,454), 29407 (West Ashley, 2,261). Hurricane Hugo in 1989 alone produced 9,591. Since 2015 there have been 7,133 more.

About 12% of paid claims were on properties rated outside the high-risk A and V zones. Flood and homeowners coverage in South Carolina.
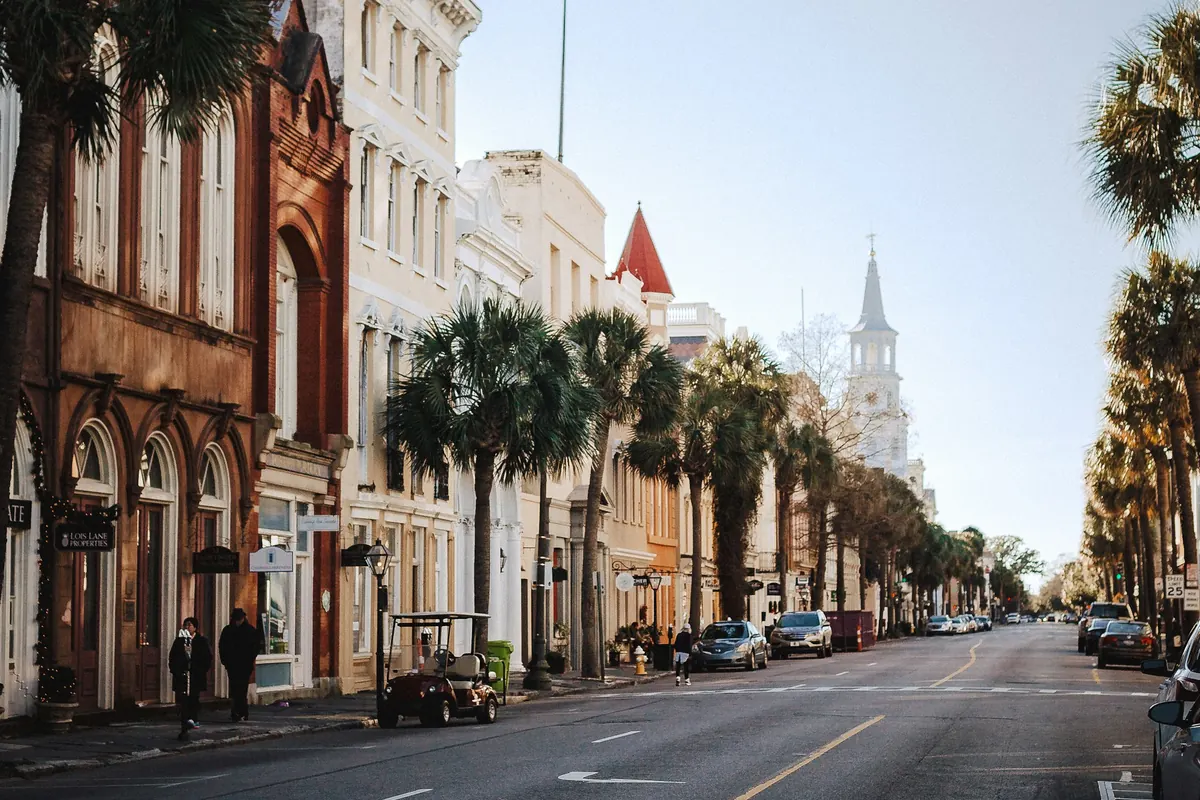
A palm-lined street in downtown Charleston with church steeples ahead
On the peninsula the median home was built before 1940 (Census ACS). Photo: Jake Warren / Unsplash

Areas we cover

Charleston and the neighborhoods around it

Also downtown Charleston (29401, 29403), the beach towns of Isle of Palms and Sullivan's Island, and outlying towns from Moncks Corner to Awendaw.

Questions Charleston homeowners ask

How much does mold removal cost in Charleston?

Fixr puts most mold remediation jobs at $1,500 to $9,000, with a $3,500 national average, and $10 to $30 per square foot. Bob Vila gives a lower range of $1,125 to $3,439. A crawl space job is often $500 to $2,000; mold in the HVAC system runs $3,000 to $10,000. Charleston prices vary by company and by how much material has to come out, so get the scope in writing.

What is the average cost of water damage repair?

Fixr lists water damage restoration at $1,200 to $5,000, with a $3,000 national average. Bob Vila gives $1,305 to $5,707. Clean water from a supply line costs less per square foot ($3.75 to $4.25) than sewage or flood water ($7 to $7.50), and rebuilding is extra.

How long does water damage restoration take?

Drying usually takes at least three days, according to Fixr, and Bob Vila puts it at about 72 hours for most areas. Rebuilding can take several more weeks to months, depending on how much was removed. Waiting on an insurance adjuster or on materials adds time.

Is mold considered uninhabitable in South Carolina?

South Carolina's landlord-tenant law doesn't mention mold by name. It does require landlords to follow building and housing codes that affect health and safety, and to keep the home fit and habitable (S.C. Code 27-40-440). If a landlord doesn't fix a serious problem after written notice, the tenant may be able to end the lease after 14 days (27-40-610). This is general information, not legal advice.

Will my homeowners insurance pay for this?

Usually when the water is sudden and accidental, like a burst pipe, and usually not when it comes from flooding, which needs a separate flood policy. The SC Department of Insurance says a standard homeowners policy doesn't cover flood damage, including storm surge. Slow leaks and long-term seepage are often excluded. Read your policy and ask your agent.

Who will come to my house?

An independent restoration company that serves your ZIP. Lowcountry Restoration Pros is a referral service; we pass along your request so you don't have to call around. Before you agree to anything, ask the company how it documents moisture, and for proof of insurance.

More questions and answers

Get the house dry, and keep it that way

One request, one local company, a written price before any work.